Collect
Ingest GPS tracks, dive depth, temperature, acoustic measurements, and sighting logs.
Raw data enters the fjord.CETACEAN BUSINESS INTELLIGENCE
Serious data engineering. Real Arctic photography. A statistically indefensible number of narwhal jokes.
Illustrative demo metrics. The narwhals have declined to certify the quarterly numbers.
ANALYTICS PIPELINE
Good analytics is not a magic horn. It is a repeatable, testable process with clear inputs, sensible transformations, and fewer mysterious spreadsheets.
Ingest GPS tracks, dive depth, temperature, acoustic measurements, and sighting logs.
Raw data enters the fjord.Remove duplicates, normalize units, fill gaps, and validate sensor quality before anyone makes a chart.
Because “close enough” is not a schema.Build features for migration clusters, feeding behavior, anomaly detection, and habitat prediction.
The tusk remains a feature, not a primary key.Turn results into dashboards, maps, alerts, and decision-ready analytics people can actually use.
Finally: charts that do not need a meeting to explain.DATA REPRESENTATION
Most demo observations cluster between 600 and 1,000 meters. The narwhals call this “Tuesday.”
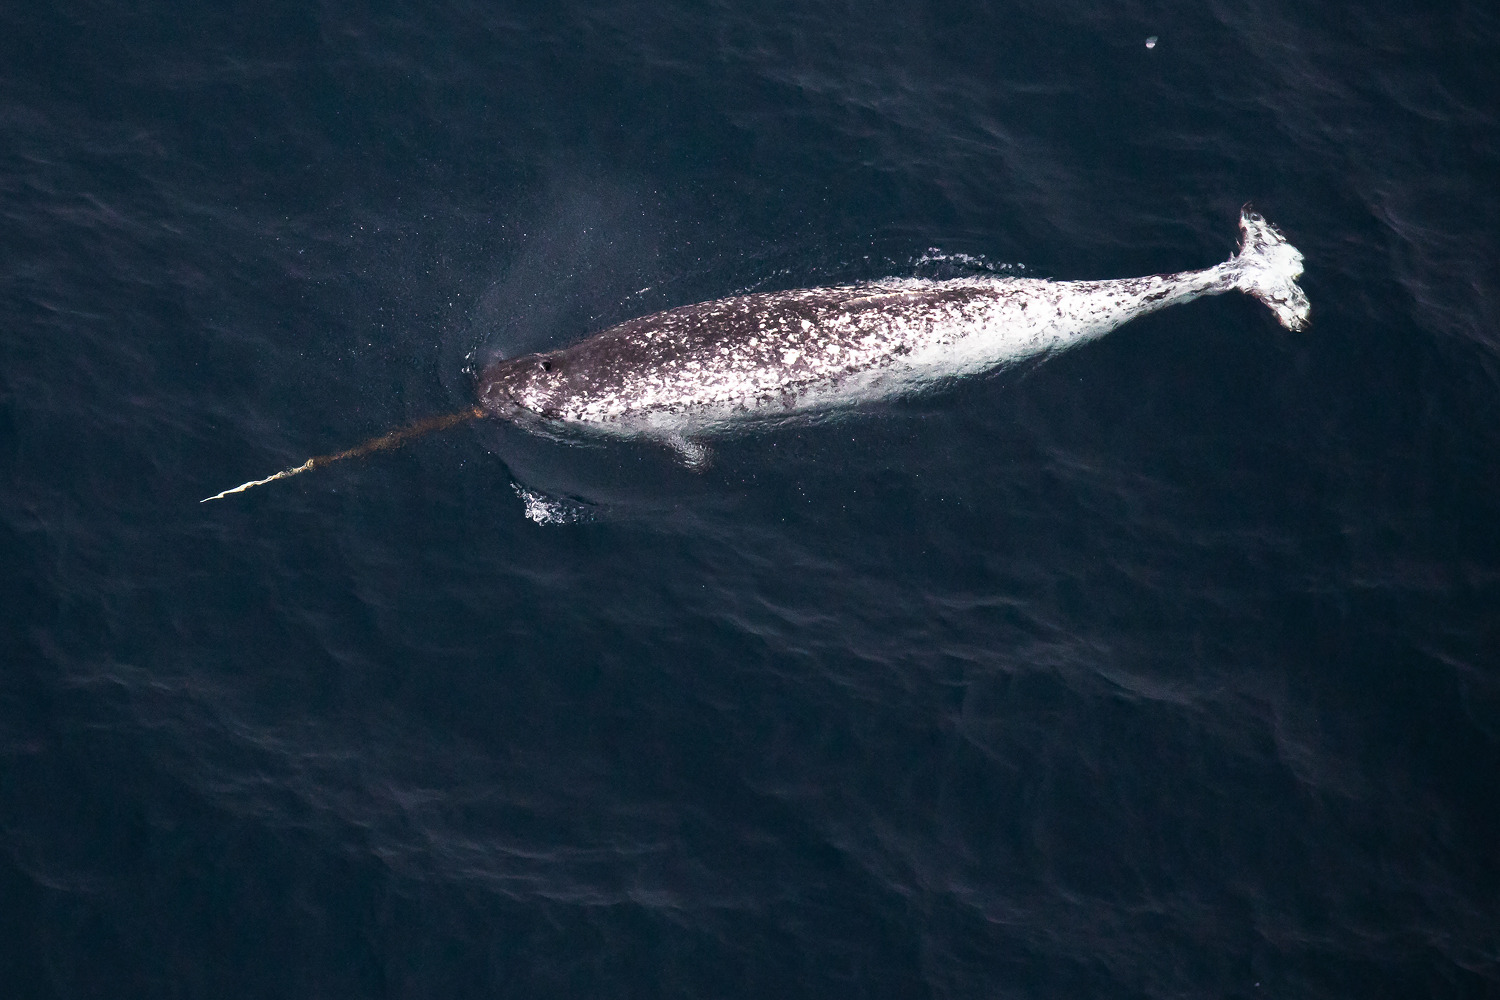
Real photography keeps the presentation credible, while the copy does its best to undo that.
ENGINEERING PRACTICES
Modern data analytics engineering blends software design, database architecture, statistical modeling, quality gates, automated testing, observability, and communication.
FIELD NOTES
Strong systems expect missing values, shifting conditions, noisy sensors, changing definitions, and stakeholders who remember a different version of the metric.
EXAMPLE INSIGHT
When dive depth, water temperature, and migration timing are modeled together, analysts can identify likely feeding zones and detect environmental changes earlier.